
Abstract
During the disequilibrium of excess bank reserves, the lack of demand keeps inflation low as the velocity of money slows down and the central bank's concern turns to deflation. The suggested framework for operating monetary policy during this disequilibrium is for the central banks to allow the equilibrium of interest rates on cash to stay at 0%, use quantitative easing to protect against deflation; and once deflation is no longer a problem reduce the central bank's balance sheet with the yield curve anchored at 0%. This enables the central bank to normalize its balance sheet without causing a taper tantrum. The temporary cheap capital stimulates the economy until demand picks up again and interest rates naturally rise as excess bank reserves return to equilibrium at 0.
Contents
For the first time since the Great Depression, excess bank reserves are no longer at 0, currently at $2 trillion, meaning there is more cash than there is demand causing the equilibrium of interest rates to be 0%, as commercial banks compete to lend out their excess bank reserves. The monetary framework to stimulate demand after a financial crisis has never been found. After the Great Depression, the demand came from WWII. Today, demand could come from a massive infrastructure build, but without fiscal stimulus, it is up to monetary policy to stimulate demand for the private sector while keeping inflation low. This working paper with the mathematics to support it, humbly suggests a Monetary Policy for Excess Reserves. This framework would stimulate demand while keeping inflation low and normalize the balance sheet without causing a taper tantrum.
The excess supply of bank reserves are due to liquidation of loans & investments into cash which is deflationary. This lack of demand delays purchases, slowing down the velocity of money, keeping inflationary pressures at a minimum. This was the case in the Great Depression until WWII, when inflation for the period was -2% and in 1934 only reached as high as 3%. Between 1942 and 2008, excess bank reserves were at 0, in an equilibrium of supply and demand, meaning all available capital was used to make purchases. The size of the monetary base affected inflation but when there is more cash than demand, the size of the monetary base is no longer inflationary.
The paradigm shift is two fold for monetary policy. First, focusing on the equilibrium or disequilibrium of excess bank reserves to determine whether central banks should be concerned about inflation or deflation. When in equilibrium, when excess bank reserves are 0, when demand for cash is greater than supply, when all available cash is making purchases, the concern for the central bank is inflation. The opposite is true when in disequilibrium, when excess bank reserves are greater than 0, when supply of cash is greater than demand, when capital delays making purchases, the concern for the central bank is deflation. The second paradigm shift is moving from a mathematical model to determine the natural rate for cash, to observing it in the equilibrium of excess bank reserves. Typically, when excess bank reserves are 0, a mathematical model is used to estimate the demand for cash and inflationary expectations. When excess bank reserves are greater than 0, the natural rate is simply 0%. When excess bank reserves return to 0, this paper suggests giving the central banks further transparency into bank lending and investments to observe real-time where demand pressures are coming from. Computers can observe a million times per second giving the central banks immediate notice of any potential problems.
When the natural rate for cash is observed in the interest rate paid for excess bank reserves; the behavior of interest rates, the creation of capital and the mathematics, all fall into place. When cash trades near 0%, the Impact of Monetary Policy is nonlinear and quite large, and at 0%, a near-infinite amount of capital can be created. Any interest rate paid or charged on excess bank reserves by the central banks is artificial and runs the risk of slowing the economy or even worse creating asset bubbles.
The objective of monetary policy is to find the framework for the greatest economic growth, with low inflation and moderate long-term interest rates and maintain a small balance sheet to be prepared for the next financial crisis. This paper's framework suggests the excess supply of bank reserves causes the natural rate on cash to go 0%, quantitative easing protects against deflation, and once deflation is no longer a problem, the central bank can unwind its balance sheet with a yield curve anchored at 0%. This enables the central bank to normalize its balance sheet to prepare for the next financial crisis without causing a taper tantrum. When central banks allow the natural rate to be 0%, this cheap capital stimulates the economy until demand picks up again and interest rates naturally rise, as excess bank reserves return to 0.
Introduction⇧
The unintended consequences are in the US it slows down the economy and encourages US banks to receive risk free interest from the Fed rather than lend out the cash to the private sector and buy US treasuries. In addition, the cost to the US taxpayer of 1% higher interest on the $20 trillion of national debt is an extra $200 billion a year over time. For Asia and Europe, negative interest rates are deflationary creating a bubble that will pop once quantitative easing stops unless Asia and Europe can generate some real growth. When there is an over supply of excess bank reserves, why do the central banks want to move interest rates on cash when they are naturally at 0%? Have the central banks not yet replaced their old domestic economic models or have they implemented policy, where the means justify the end results? Either way, monetary policy must be grounded in the mathematics and the laws of behavior for interest rates or run the risk of harming the economy or even worse creating asset bubbles.
The monetary policy outlined in this paper is supported by the economic models discussed below ruled by the behavior of interest rates and excess bank reserves and the mathematics to graph it. When excess bank reserves are greater than 0, currently at $2 trillion, commercial banks compete to lend out their excess cash and the interest rate paid for cash naturally goes to 0%. The downward pressure on interest rates continues until excess bank reserves are used up and are again in a supply and demand equilibrium at 0, less than $3 billion. Excess bank reserves can never go below 0 because commercial banks by law must meet their minimum regulatory reserve requirements. If reserves are needed, the bank must entice other banks to lend them cash and if excess bank reserves are near 0 this demand drives interest rates higher. This equilibrium of excess bank reserves at 0 establishes the natural rate based on the current demand for cash and inflation expectations. In this equilibrium, the central banks are most effective at influencing interest rates without the need of a large balance sheet. Since the amount of excess bank reserves are observed on a daily basis, the banking system will know when to expect a change in interest rates.
In sum, the monetary policy outlined in this paper would let the interest rate paid on cash naturally be 0% and would wait until demand is in equilibrium with supply to naturally drive interest rates higher. By waiting until excess bank reserves are in an equilibrium at 0 enables the economy to benefit from cheap capital until demand and inflation picks up again. The only tightening that would be done in the name of normalization is the unwinding of the central bank's balance sheet after a quantitative easing to be prepared for the next financial crisis. Even with the unprecedented amounts of bonds for sale due to the growing national debt and the unwinding of the central bank’s balance sheet, by allowing the yield curve to be anchored at 0% widens the curve to historic levels but keeps long term interest rates low avoiding the dreaded taper tantrum. This widening supports the banking system and makes available cheap capital to help finance the national debt and stimulate demand.
Overview⇧
Central banks embody the trust and stability for the banking system and the local currency. They are battling deflation coming from global competition for good jobs, increased productivity from technology and the lack of demand for capital. They are challenged by fiscal policy that has been running historic deficits to maintain entitlement programs without the adequate tax revenue to finance them and must find the path for the greatest economic growth with low inflation and moderate long-term interest rates.
The isolated domestic economic models created in the 19th and 20th century are no longer relevant in a competitive global marketplace. In a global economy, full employment is no longer inflationary, as there is always someone willing to do the job cheaper but rather it is the demand for capital that reflects inflationary expectations. In 2008, for the first time since the Great Depression, we witnessed how interest rates for cash naturally go to 0%, when the supply of cash is greater than the demand, and we have witnessed the nonlinear impact of a change in interest rates off of 0%.
Typically, the laws of behavior for interest rates have been experienced from one side, where the supply of excess bank reserves have been in an equilibrium with demand at 0 and interest rates have been greater than 0%, typically above 3%. The old economic models have caused the central banks to believe the impact of monetary policy is linear, full employment is inflationary and negative interest rates are not deflationary. They have ignored the Natural Equilibrium of Interest Rates and how it relates to excess bank reserves. All believe in quantitative easing but none have the strategy to unwind it, other than let it mature one day far into the future. This paper does outline the strategy for unwinding quantitative easing by letting short term interest rates naturally go to 0% and selling off the balance sheet causing the yield curve to widen further supporting the banking system and consumer credit.
After 2008, we experienced both sides of the equilibrium so now we can mathematically model the behavior of interest rates and the impact of monetary policy. We can show, when the supply of bank reserves is greater than demand the interest rate paid naturally goes to 0%, and a small move in interest rates at near 0% has a huge impact and negative interest rates are deflationary. The Natural Equilibrium of Interest Rates models the rate paid for cash given the supply and demand of excess bank reserves. This enables the central banks to know where interest rates would naturally be without intervention. The Impact of Monetary Policy models the impact of a change in interest rates and this enables the central banks to quantify the impact of either a tightening or an easing.
Current Situation⇧
The monetary policy to stimulate demand to use up the excess supply of bank reserves has never been implemented. During the Great Depression the demand came from WWII.
Globally, the Federal Open Market Committee has been leading the way for monetary policy. The Board of Governors of the Federal Reserve System have some of the finest economist and mathematicians and Thomas Laubach, Director of Monetary Policy for the Federal Reserve Board has tackled with proficiency the mathematics for determining the "natural rate of interest". His words say it best:
The imprecision comes from economist using the Symmetric Properties of Equality to estimate the natural rate of interest rather than observing it realtime in the equilibrium of excess bank reserves. For example, though it is true short-term interest rates affect output, that does not necessarily mean through the Symmetric Properties of Equality, output affects short term interest rates - and certainly not in a global economy. Rather the natural rate of interest can be observed in the equilibrium of bank reserves. Now that computers can observe a million times per second, the central banks can create the technological transparency needed to quantify demand for cash in specific areas. When inflation is a concern, this transparency enables the central bank to determine where the inflationary pressures are coming from. This gives the central bank the precision to know where capital is demanded enabling either a micro adjustment through regulation to a specific area or a macro adjustment to interest rates by affecting the equilibrium of excess bank reserves in the "repo" market.
After the financial crisis, globally the central banks are dealing with the excess bank reserves subjectively by creating a narrative rather than objectively dealing with them in their disequilibrium. The central banks chose different strategies to remove the excess supply of bank reserves to give the markets time to recover and generate demand. The Bank of Japan and European Central Bank chose to charge interest on excess bank reserves causing negative interest rates. Both the BOJ and ECB hoped to encourage banks to lend out excess cash and lower the sovereign debt burden. In the US, in the name of normalization, the FOMC with congressional approval, chose to pay interest on excess bank reserves, currently $20 billion a year at 1% on $2 trillion. The unintended consequences are it also slows down the US economy and encourages US banks to receive risk free interest from the Federal Reserve rather than lend out the cash to the private sector and buy US treasuries. Currently, by paying 1% on excess bank reserves causes the interest on the $20 trillion of national debt is higher by $200 billion a year over time. Every 0.25% rise in interest rates represents $50 billion a year in interest on the US national debt.
The mathematics of the Impact of Monetary Policy shows that both a move to negative interest rates or positive interest rates when excess bank reserves are in disequilibrium is deflationary. When the supply of excess bank reserves are greater than demand, the central banks should let the interest rate paid on cash naturally be 0%. While demand is less than supply for cash inflationary pressures are subdued and the cheap capital encourages demand. Once demand picks up again, excess banks reserves will return back to 0 which will cause interest rates to naturally rise.
Commercial banks must maintain a minimum amount of bank reserves with their central bank equivalent to a specified percentage of their liabilities. Since each bank by law must have a certain amount of bank reserves, excess bank reserves can never go below 0. Between WWII and 2008, the amount of excess bank reserves were in equilibrium at 0, except during 9/11, when they reached $38 billion. Starting in September 2008, for the first time since the Great Depression, the supply of excess bank reserves was greater than demand. This disequilibrium is caused by capital moving from investments and loans into cash. By August 2014, excess bank reserves rose as high as $2.7 trillion in the US before leveling off as the US economy began to recover. The Federal Reserve Bank of St. Louis maintains transparent data as shown to the right.
Behavioural Models ⇧
Capital Markets are a force of nature and as such have natural equilibriums that can be observed in real time. An equilibrium is a natural calm state and for our purposes is found in the balance of supply and demand for capital. Modeling the behaviour of cash, one-day capital is simple in that it can be graphed in 2D on a X Y chart. We can use two sided limit functions, lim f(x){ to graph the behaviour of the equilibrium.
Equilibrium of Excess Bank Reserves ∞⇧
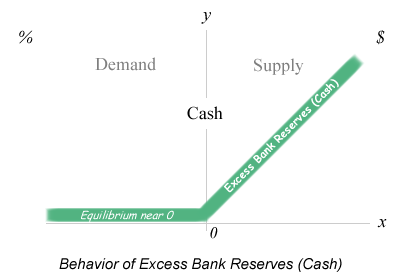
Around the globe, commercial banks must maintain a minimum amount of bank reserves with their central bank equivalent to a specified percentage of their liabilities. Since each bank by law must have a certain amount of bank reserves, excess bank reserves can never go below 0. If a bank needs reserves, it can borrow from a bank that has excess reserves and by the end of the day the objective is to have no excess reserves due to the opportunity cost of holding cash. While demand for cash is greater than supply, excess bank reserves will naturally be 0. When supply is greater than demand, when excess bank reserves are greater than 0, the supply is simply positive excess reserves.


Equilibrium of Interest Rates ∞⇧
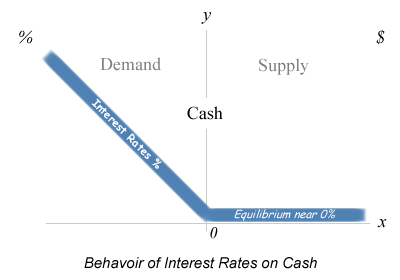
When supply is greater than demand for excess bank reserves commercial banks compete to lend out their excess cash and cause interest rates on cash to naturally be 0%.
Between 1942 - 2008, excess bank reserves have always been in a supply and demand equilibrium at 0 so the interest rate paid for cash
reflected the demand for cash and inflationary expectations.
The model of this behaviour is graphed on the right and the mathematics to graph it are are below:

Natural Equilibrium of Interest Rates ∞⇧
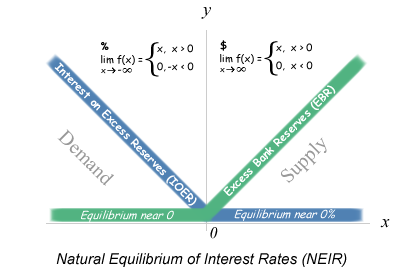
The Natural Equilibrium of Interest Rates can be directly observed in the fed funds market, as the interest rate paid for excess bank reserves.
Within this equilibrium of supply and demand, there are two outcomes which depend on the supply of excess bank reserves which are either 0 or greater than 0.
Typically, when the demand for cash is greater than supply, where excess bank reserves are 0, the interest rate paid reflects the demand for cash and inflation expectations.
Currently and was in the Great Depression, when the supply of cash is greater than demand, where excess bank reserves are greater than 0,
the interest rate naturally is 0%, as commercial banks compete to lend out their excess reserves.
if excess bank reserves > 0 ⇒ interest rates = 0%
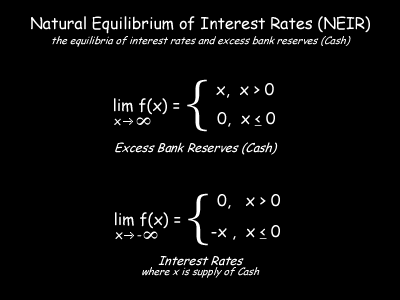
In the limit function for Interest Rates, x is the supply of excess bank reserves and Y is interest rates. The top half of the Interest Rates limit function, where supply is greater than demand for excess bank reserves is 0 because banks compete to lend out their excess reserves driving interest rates to 0% and banks would never pay interest on reserves to lend them out so they would never go negative. This has been the experience since 2008, until the central banks artificially manipulated the interest rate on excess bank reserves where the Fed paid interest on reserves to raise rates and the BOJ and ECB charged interest on reserves to drive rates negative. Therefore without central bank manipulation interest rates on excess bank reserves would naturally be 0%. The bottom half of the Interest Rates limit function experienced prior to 2008, where demand is greater supply, so when x is negative f(x) multiplied by -x results in a positive y where y is positive interest rates. Prior to 2008, interest rates have always been positive when demand was greater than supply and excess bank reserves were 0.
The limit function for excess bank reserves is straightforward in that the outcome is a function of bank regulations where x represents supply vs demand and y represents excess bank reserves. The top half of the limit function for excess bank reserves is when supply is greater than demand so when x > 0 f(x) = x, the quantity of excess supply of bank reserves. The bottom half of the function is by law kept at 0 because when demand is greater than supply, banks must borrow reserves to meet their minimum requirements causing excess bank reserves to never go negative. In fact, when you look at the actual graph of excess bank reserves since 1960, they have been at 0 until 2008.
Impact of Monetary Policy⇧
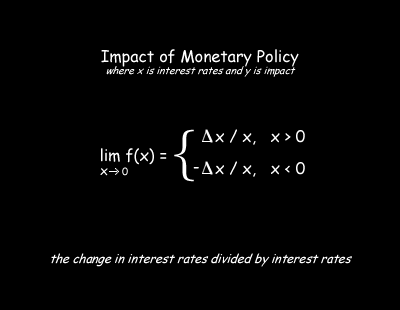
The Impact of Monetary Policy is quantified as
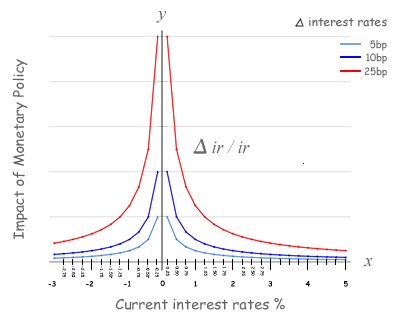
the delta change in interest rates divided by interest rates (ΔIR/IR) which is non-linear and has a vertical asymptote at 0% so
a small move in interest rates when rates are near-zero has a large impact.
In short, the impact of a 5 basis point move near-zero is equivalent to a 25 basis point move when interest rates are at 1.25%
and two times more impactful than when interest rates are at 3%.
This enables the Federal Reserve to micro-adjust monetary policy, and at 0%, the Federal Reserve is most effective at supporting the U.S. economy
when there is an over supply of excess bank reserves.
Not until there is an equilibrium again at 0 between supply and demand for excess bank reserves will we see inflationary pressures.
Once excess bank reserves are at 0, the natural equilibrium of interest rates will cause fed funds to rise to compensate for inflation.
The Role of Monetary Policy⇧
For the government and the country, the ideal situation is for all its citizens to be productive, healthy and educated. The triad of governmental policy responsible for productivity are fiscal, monetary and regulatory which are charged with economic growth for the country. Monetary policy is charged with maximizing employment, stabilizing prices, and moderating long-term interest rates. Maximum employment in a global economy is far greater than what is currently being achieved, as the low US participation rate would suggest. In the past, employment in an isolated domestic economy was a finite resource and typically demand for capital was greater than supply, so inflation was a concern. However, when everyone is competing for a good job globally, and the supply of excess bank reserves are greater than demand, the central banks should be concerned about deflation.
The challenge for monetary policy is fiscal policy has been running historic deficits to maintain entitlement programs without the adequate tax revenue to finance them. Historic high deficits are unsustainable, so the government must find ways to stimulate the economy to generate more tax revenue. Another challenge for monetary policy is regulatory policy, where burdensome regulations have decreased demand for capital and made banks less likely to loan capital. Ultimately, monetary policy must find the path for the greatest economic growth with 2% inflation and moderate long-term interest rates.
Federal Reserve Bank Policy⇧
The Federal Reserve Act of 1913 was passed to create a government bank able to provide capital to the private banking system during a time of crisis. The Federal Reserve employed quantitative easing during the financial crisis of 2008 to provide liquidity to protect against deflation. During this period, the Federal Reserve's balance sheet grew to over $4.4 trillion and excess bank reserves grew to as high as $2.7 trillion.
The Financial Services Regulatory Relief Act of 2006, Sec. 201 allows balances maintained by depository institutions at a Federal Reserve bank to receive interest. The interest rate on required reserves (IORR rate) is determined by the Board and is intended to eliminate effectively the implicit tax that reserve requirements used to impose on depository institutions. The interest rate on excess reserves (IOER rate) is also determined by the Board and gives the Federal Reserve an additional tool for the conduct of monetary policy.
Global Deflation⇧
Central banks are battling deflation coming from global competition for good jobs, increased productivity from technology and the lack of demand for capital. The graph to the right shows US productivity growth and median family income over the past 65 years. The chart suggests that US productivity will continue while US wages remain weak. The chart also shows wages decoupling from productivity in the early 80s, when the US economy opened up globally, starting with Japan and the auto industry. In effect since the early 80s, the US worker has been forced to compete against lower global wages.
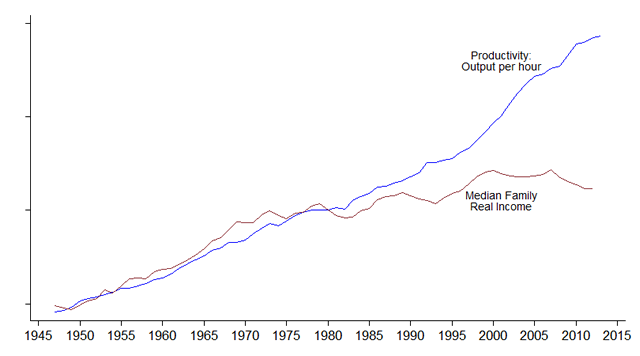
The empirical evidence demonstrates globalization is deflationary, even in the face of a weakening currency. The advanced economies in Asia, Europe and the Americas are faced with deflationary pressures and have governments with historically high debt. In short, the only stimulative capital available to these economies is from their central banks. Near-zero monetary policy provides the tools and the impact needed to stimulate these diverse economies while maintaining control over inflation.
Historical Perspective⇧
Leading up to 1980, US inflation grew and interest rates rose as the price of oil grew 10 fold as the purchasing power of US consumers rose. The rising purchasing power of the US consumer came from women joining the workforce and the securitization of the mortgage market. During this period, this rising purchasing power competed for limited domestic products that drove inflation and interest rates to historic highs. Interest rates peaked in the early 80’s as the US economy began to open up globally. The period from 1984 to 2007 was driven by globalization, the increase in worker productivity and the refinancing of the mortgage market as interest rates went down to historic lows.
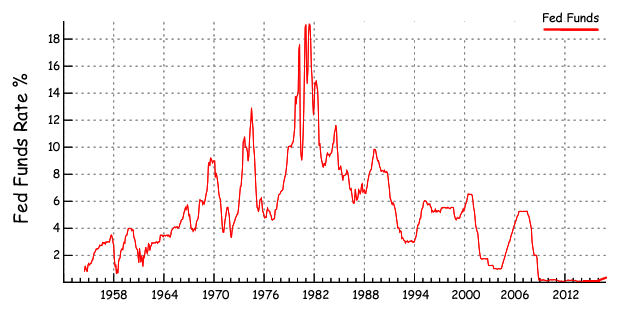
Since the Federal Reserve had never tightened when the Fed Funds rate was at 0%, and there was no empirical evidence to suggest otherwise, the Federal Reserve expected the impact of their monetary policy to be linear, much like the times when the Fed Funds rate was higher. The equation above demonstrates the Federal Reserve was right to expect the effects of monetary policy to be linear, but only if the Fed Funds rate was above 3%. By contrast, when the Fed Funds rate are near-zero, the impact of monetary policy is nonlinear and the effect of a 25 basis point tightening is quite substantial.
Early January 2016, the global financial markets gave us the empirical evidence that the impact of monetary policy is nonlinear. There were three forces putting pressure on global asset prices, the first was the US Federal Reserve tightening, the second was weakening oil prices and third was the People’s Bank of China weakening their currency. In the first two weeks in January, all asset classes sold off very quickly and the Dow Jones Industrial average lost over 2000 points and 11% of its value. The speed and intensity of the global market sell-off in early January in all asset classes was due to forced selling of investments made with leveraged capital.
Quantitative Monetary Policy enables central banks to have "unlimited capital" at their disposal but any quantitative capital added to the central bank's balance sheet must be removed in a timely manner to be prepared for the next crisis. When the central bank begins quantitative tightening short term rates are naturally at 0% and at the end of quantitative easing the sale of bonds widens the yield curve which further supports the banking system. The wider the yield curve gets the greater the profits are for the banks as they borrow short term to lend long term. Not until excess bank reserves are at a supply and demand equilbrium of 0 will we see short term rates rise as the natural equilibrium drives interest rates higher as demand increases pricing in the implied inflation rate.
References⇧