Impact of Monetary Policy
Contributor(s): Peter del Rio
Last Edited: 2017-01-17
January 17, 2016


Abstract
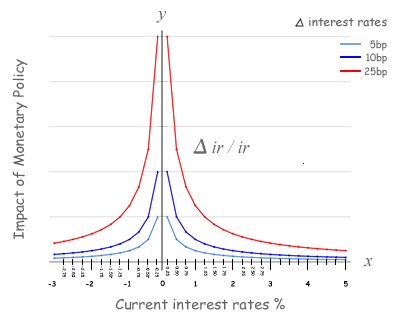
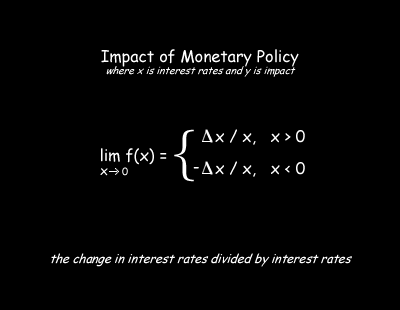
The equation that captures the monetary impact of an interest rate move is the change in interest rates divided by current interest rates. The equation (Δ ir / ir) captures the multiplier effect of leverage on capital when interest rates approach 0%. The graph of the equation demonstrates that the impact of monetary policy is nonlinear and has a vertical asymptote at 0%. In sum, at near-zero interest rates, a small move in monetary policy has a huge impact and at 0%, a near-infinite amount of capital can be created.
The equation (Δ ir / ir) captures the multiplier effect of leverage on capital when interest rates approach 0%. It also demonstrates the near infinite amount of capital created by leverage at 0% evaporates very quickly as the central bank moves off of 0% - either positively or negatively. In short, the impact of a 5 basis point move near-zero is equivalent to a 25 basis point move when interest rates are at 1.25% and two times more impactful than when interest rates are at 3%.
Over the past 60 years, the US Federal Reserve’s Fed Funds rate has spent most of the time above 3% (See chart below). The equation also demonstrates that when interest rates are 3% or greater, the impact of monetary policy looks linear. So previously, without empirical evidence, it is understandable why many view the impact of monetary policy as linear and believe more than one tightening is necessary for monetary policy to be impactful.

Leading up to 1980, US inflation grew and interest rates rose as the price of oil grew 10 fold and the purchasing power of US consumers rose. The rising purchasing power of the US consumer came from women joining the workforce and the securitization of the mortgage market. During this period, this rising purchasing power competed for limited domestic products that drove inflation and interest rates to historic highs. Interest rates peaked in the early 80’s as the US economy began to open up globally. The period from 1984 to 2007 was driven by globalization, the increase in worker productivity and the refinancing of the mortgage market as interest rates went down to historic lows.
In 2009, in response to the global financial crisis created by the mispriced mortgage market, the supply of excess bank reserves was greater than demand and by August 2014 was as high as $2.69 trillion. When supply is greater than demand for excess bank reserves commercial banks compete to lend out their excess cash and cause the Natural Equilibrium of Interest Rates for fed funds to settle at 0%. The Federal Reserve with Congressional approval paid 0.25% on the excess bank reserves to maintained the Fed Funds rate at 0 - 0.25% for over 7 years. The historically low level in the Fed Funds rate was meant to combat deflation while trying to achieve the Fed’s dual mandate of full employment and 2% inflation. During this time, US asset prices reached historic highs, inflation rose modestly, while unemployment declined to below 5%. Though inflation in the medium term had not reached the Fed’s mandate of 2% and the participation rate in employment had fallen, many in the banking industry called for the Fed to tighten in the name of “normalization.” The Federal Reserve in late December 2015 heeded the call for normalization and raised the Fed Funds rate to 0.25% - 0.50%, by paying 0.50% interest on excess bank reserves.
Since the Federal Reserve had never tightened when the Fed Funds rate was near 0%, and there was no empirical evidence to suggest otherwise, the Federal Reserve expected the impact of their monetary policy to be linear, much like the times when the Fed Funds rate was higher. The equation above demonstrates the Federal Reserve was right to expect the effects of monetary policy to be linear, but only if the Fed Funds rate was above 3%. By contrast, when the Fed Funds rate are near-zero, the impact of monetary policy is nonlinear and the effect of a 25 basis point tightening is quite substantial.
Early January 2016, the global financial markets gave us the empirical evidence that the impact of monetary policy is nonlinear. There were three forces putting pressure on global asset prices, the first was the US Federal Reserve tightening, the second was weakening oil prices and third was the People’s Bank of China weakening their currency. In the first two weeks in January, all asset classes sold off very quickly and the Dow Jones Industrial average lost over 2000 points and 11% of its value. The speed and intensity of the global market sell-off in early January in all asset classes was due to forced selling of investments made with leveraged capital.

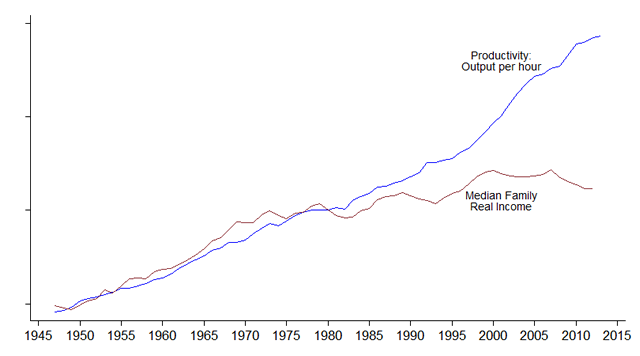
In the 21st Century, the central banks are battling deflation coming from increased productivity and global competition for good jobs. The graph above shows US productivity growth and median family income over the past 65 years. The chart suggests that US productivity will continue while US wages remain weak. The chart also shows wages decoupling from productivity in the early 80s, when the US economy opened up globally, starting with Japan and the auto industry. In effect since the early 80s, the US worker has been forced to compete against lower global wages. In 1985 to help the US worker compete globally, the Plaza Accord was implemented to depreciate the U.S. dollar in relation to the Japanese Yen and German Deutsche Mark. Over the next four years, the US dollar lost 50% of its value, but even in the face of a devaluing currency, US inflation remained under control. When you look at the Fed Funds chart in the early 80s, you see the Fed Funds rate peaked just as the US economy opened up globally.
The empirical evidence demonstrates globalization is deflationary, even in the face of a weakening currency. The advanced economies in Asia, Europe and the Americas are faced with deflationary pressures and have governments with historically high debt. In short, the only stimulative capital available to these economies is from their central banks. Near-zero monetary policy provides the tools and the impact needed to stimulate these diverse economies while maintaining control over inflation.

